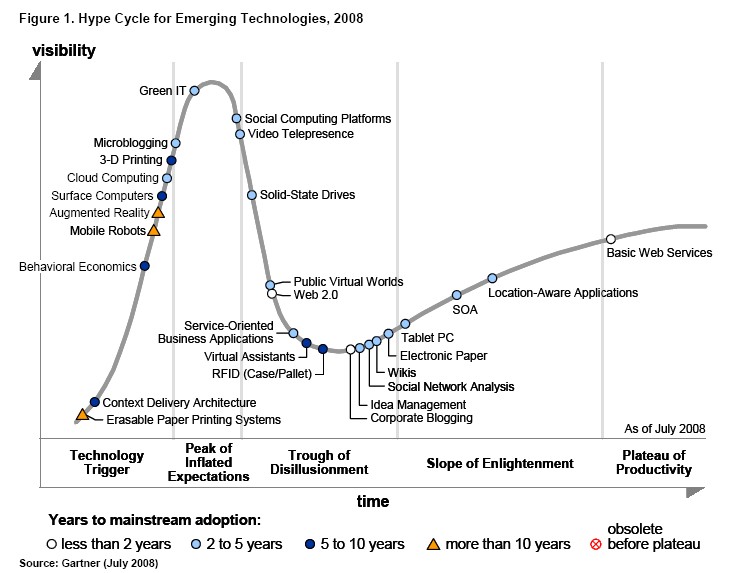
Interesting annual graph showing what Gartner Group thinks are important new technologies, and how far away from "mainstream" adoption. Latest plus a few previous years for comparison.
2012:

2011:

2010:

2009:

2008:

More historical charts here: http://adverlab.blogspot.ca/2008/08/media-history-through-gartner-hype.html

2009:

2008:
More historical charts here: http://adverlab.blogspot.ca/2008/08/media-history-through-gartner-hype.html

No comments:
Post a Comment